Most R&D organizations aren't starting their product development from a blank page. They're sitting on years, sometimes decades, of records that were never going to be consistent, because they were written before anyone thought about the need for consistency. Those records are usually treated as a sunk cost: too inconsistent to search thoroughly, too voluminous to clean up by hand, or perhaps locked up in an older software, effectively retired the day they were filed. Unlocking this data so that you can use it again is what this article is about.
Advances in LLMs have now made it possible to extract this data in a structured format so that it can be re-used again. Augmend uses LLM technology under the hood to cleanly extract all your material, equipment and measurement data from past experiments. But it does more than that. It can separate dependent variables from independent ones, and capture the relationships between the two — i.e., how changing the independent variables changes the value of dependent variables. Pooled across enough historical experiments, such relationships convert past experiments into a knowledge compendium, akin to what a senior R&D expert acquires over many years, but even more structured for easy access to all. Let us look at what is extracted using a realistic shampoo development example.

Five Real Documents, One Project
We have five realistic but diverse experimental records from a sulfate-free shampoo development program, all extracted through the same pipeline.
PP-17-026
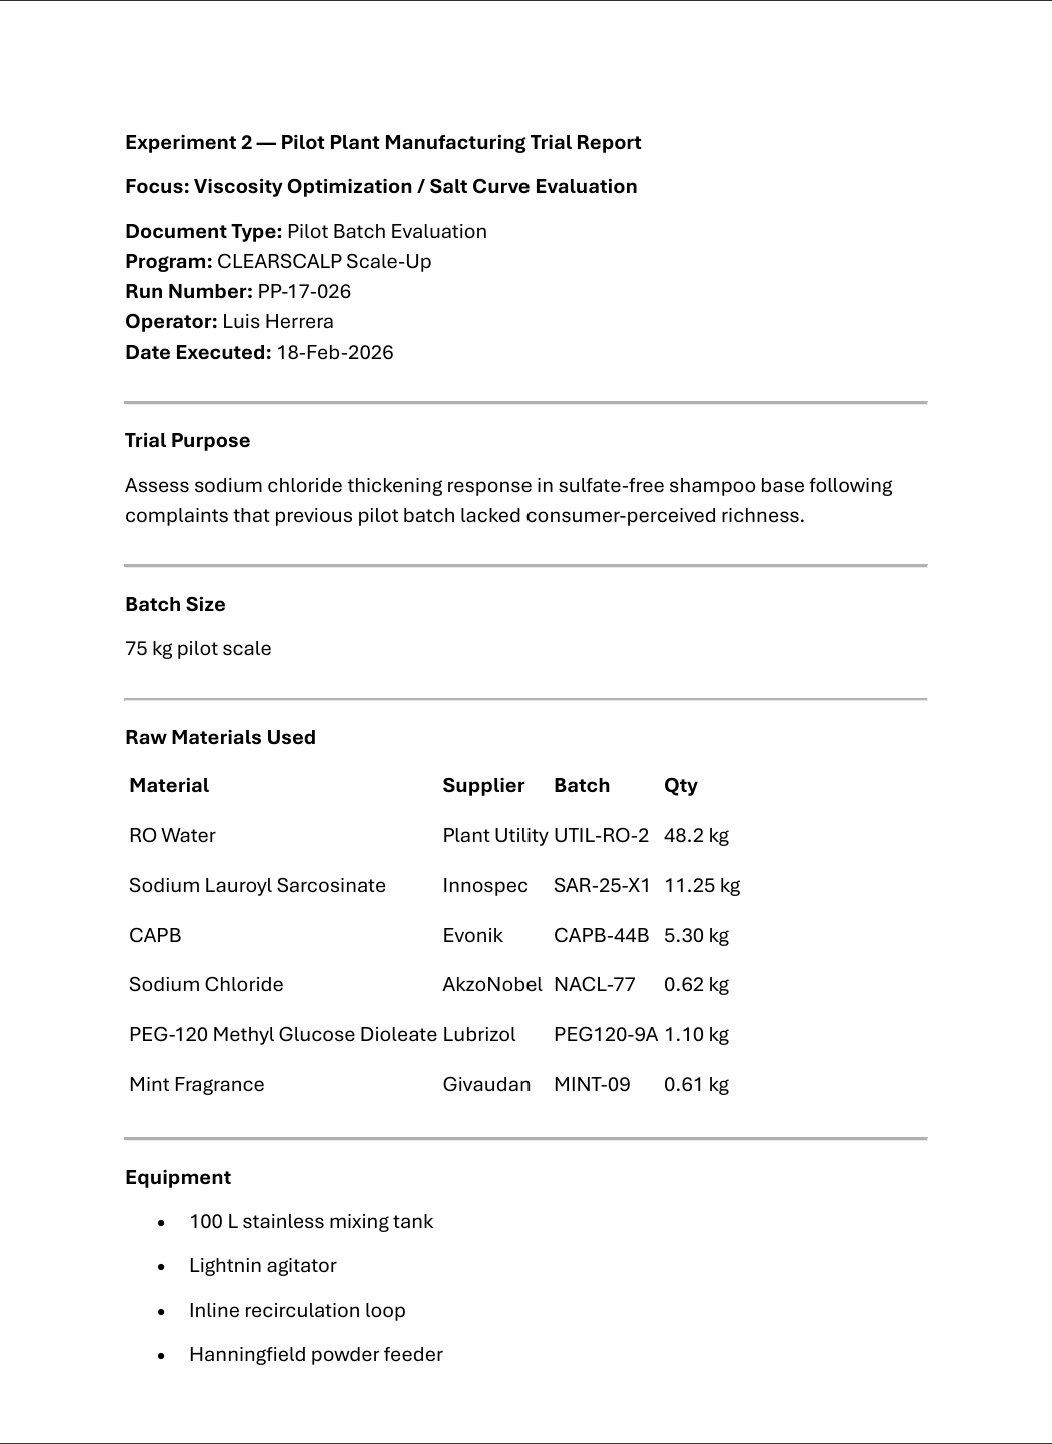
Pilot plant trial (Luis Herrera, Feb 18). Kg-scale batch with foam flagged during surfactant charging.
View PDF →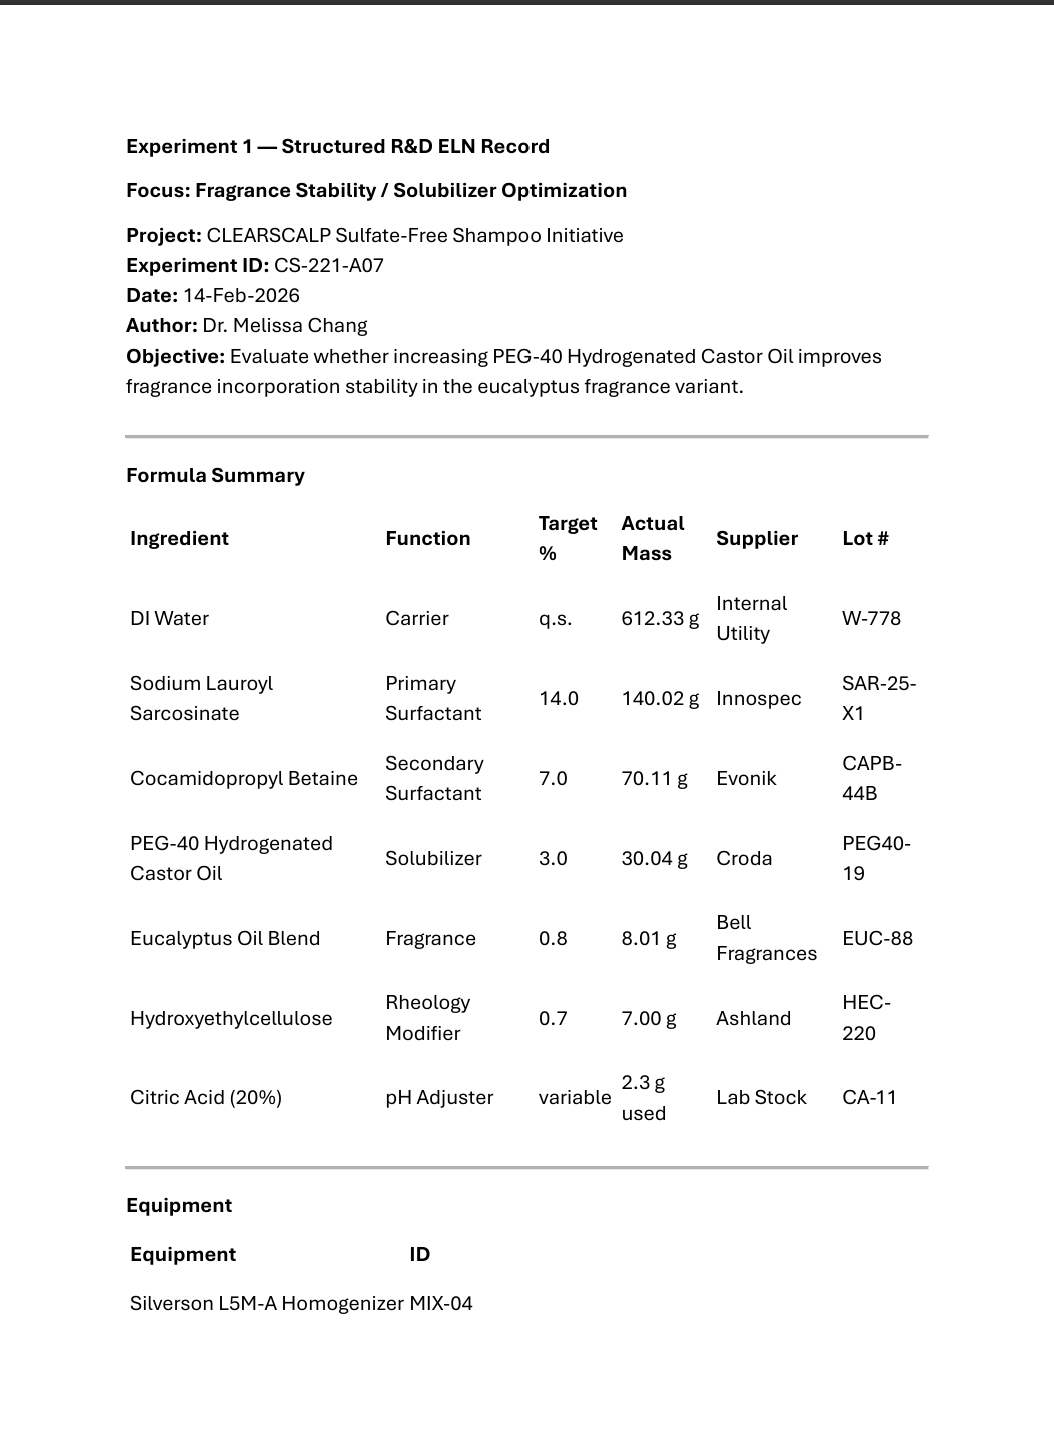
CS-221-A07 (single record)
Structured ELN (Dr. Melissa Chang, Feb 14). Notes "excessive foam during surfactant charging."
View PDF →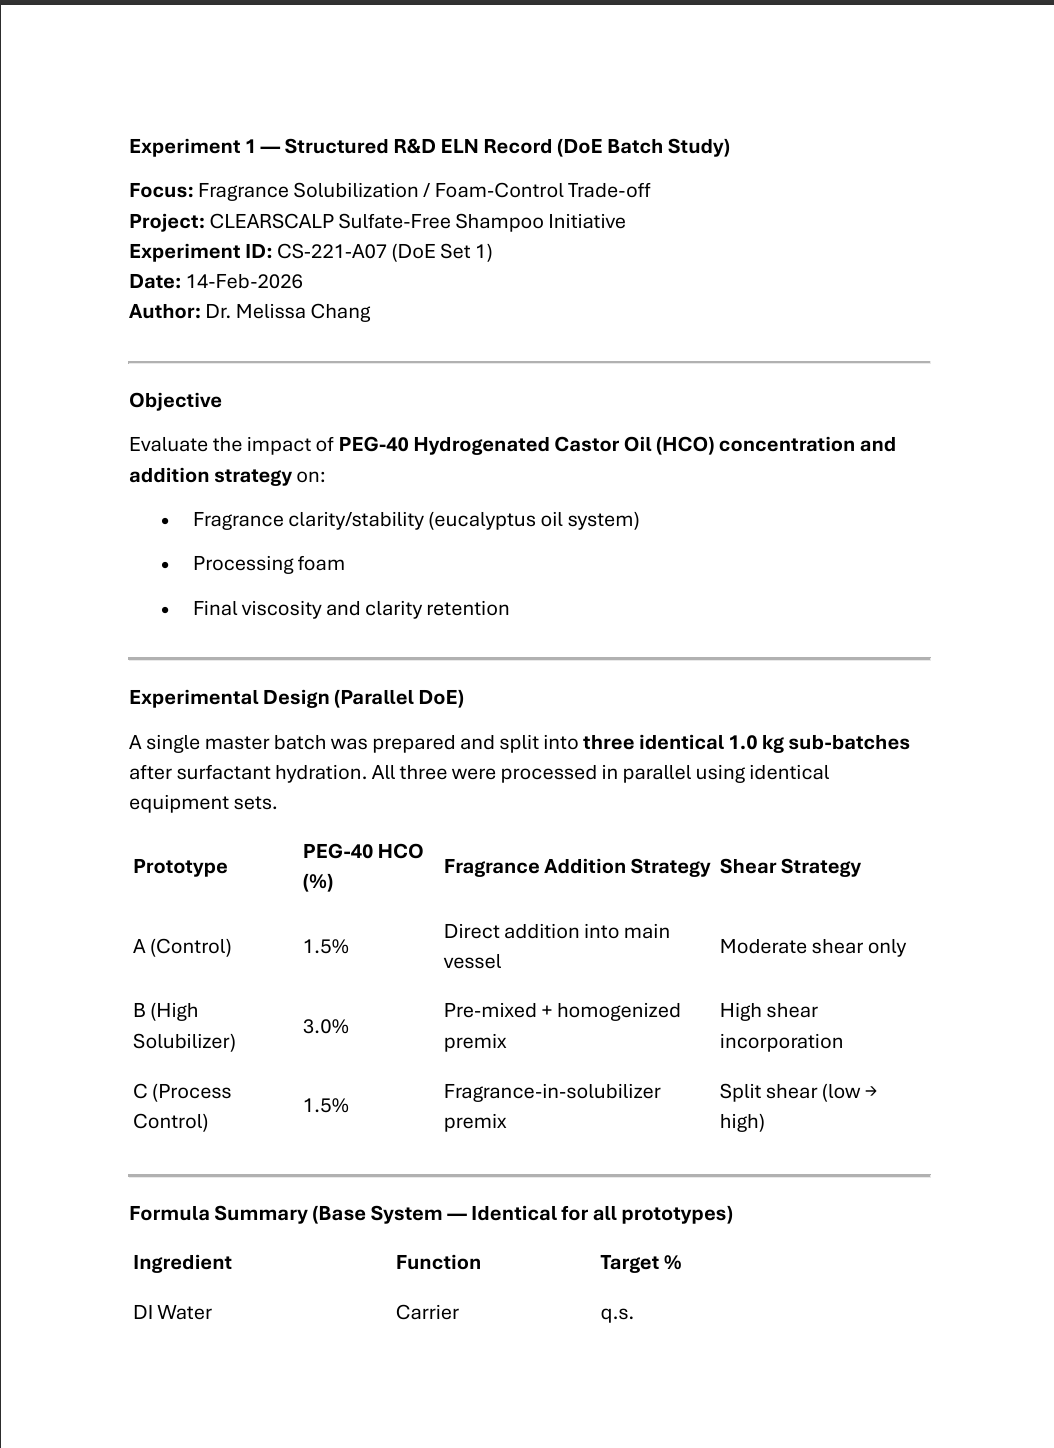
CS-221-A07 (DoE study)
Three-prototype DoE on PEG-40 HCO and shear. Prototype C won on lowest foam.
View PDF →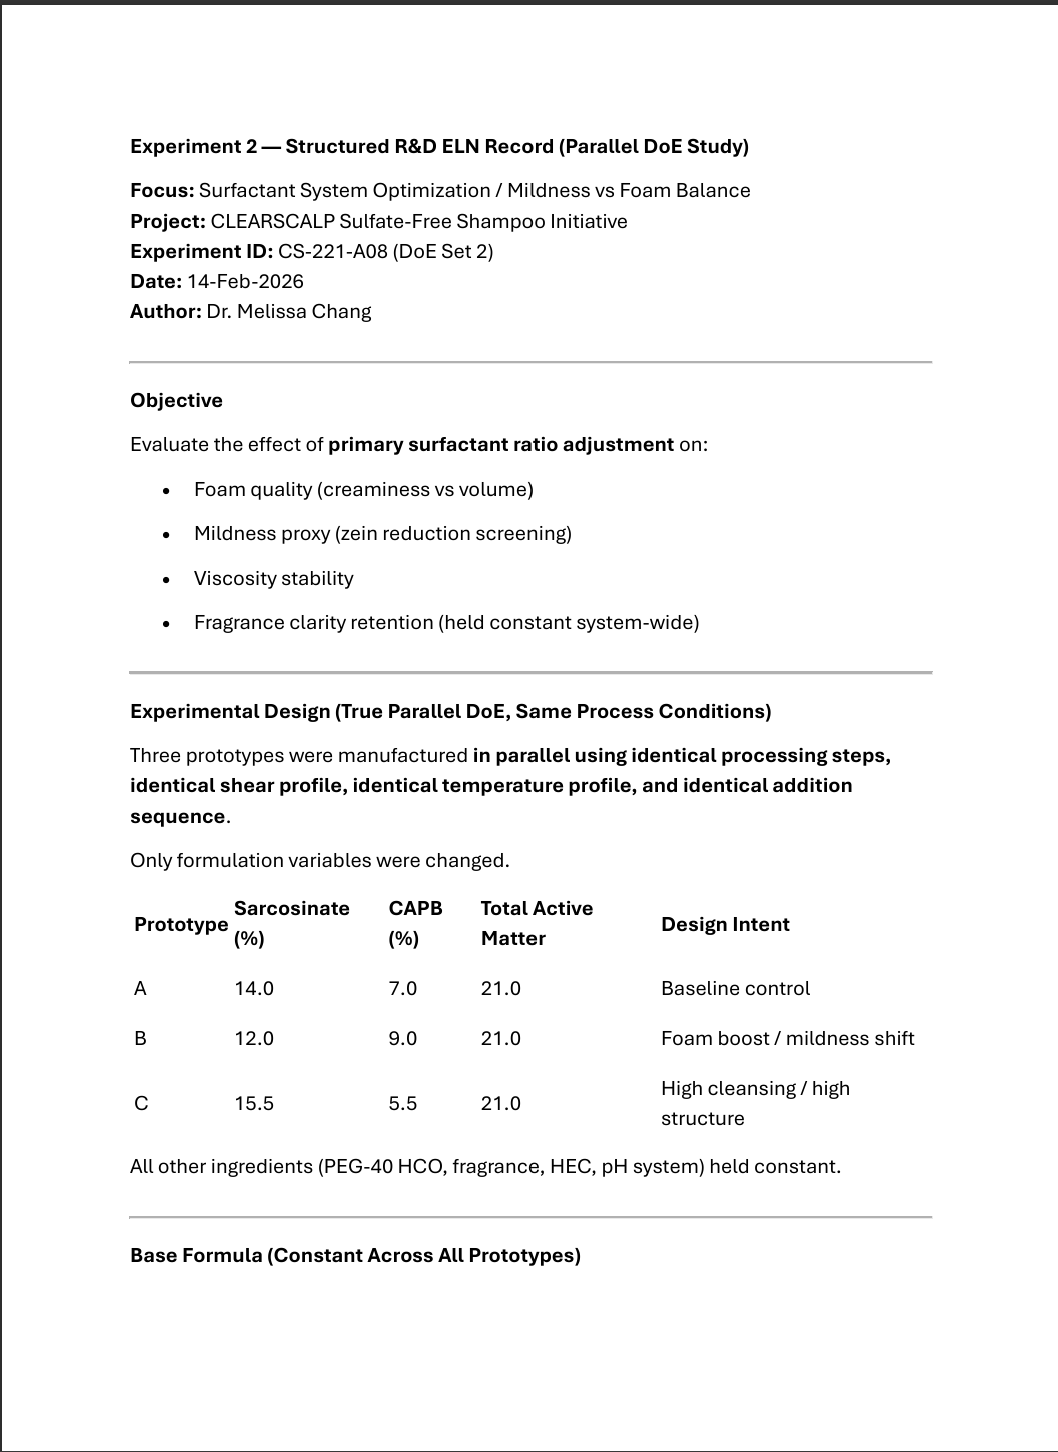
CS-221-A08 (parallel DoE)
Also Feb 14. Surfactant ratio (Sarcosinate vs. CAPB) across three parallel prototypes.
View PDF →What Gets Extracted: Three Layers
The Augmend extraction pipeline pulls out considerably more than "the numbers." It works at three layers, all linked back to the source document, regardless of how any individual record happens to be organized.
Structured output: Download the extracted relationship workbook that pools all five documents.
Download Excel1. Document and experiment structure
Title, author, date, objective, hypothesis, and for DoE studies, the design itself: what was varied, what was held constant, whether the design was factorial or sequential, which variant won, and why. For the CS-221-A07 DoE study, the extraction captures the hypothesis ("increasing PEG-40 HCO concentration and/or using high shear incorporation will improve fragrance clarity... but may increase processing foam"), the winning variant (Prototype C), and the reasoning ("process design can compensate for lower solubilizer loading").
2. Granular data
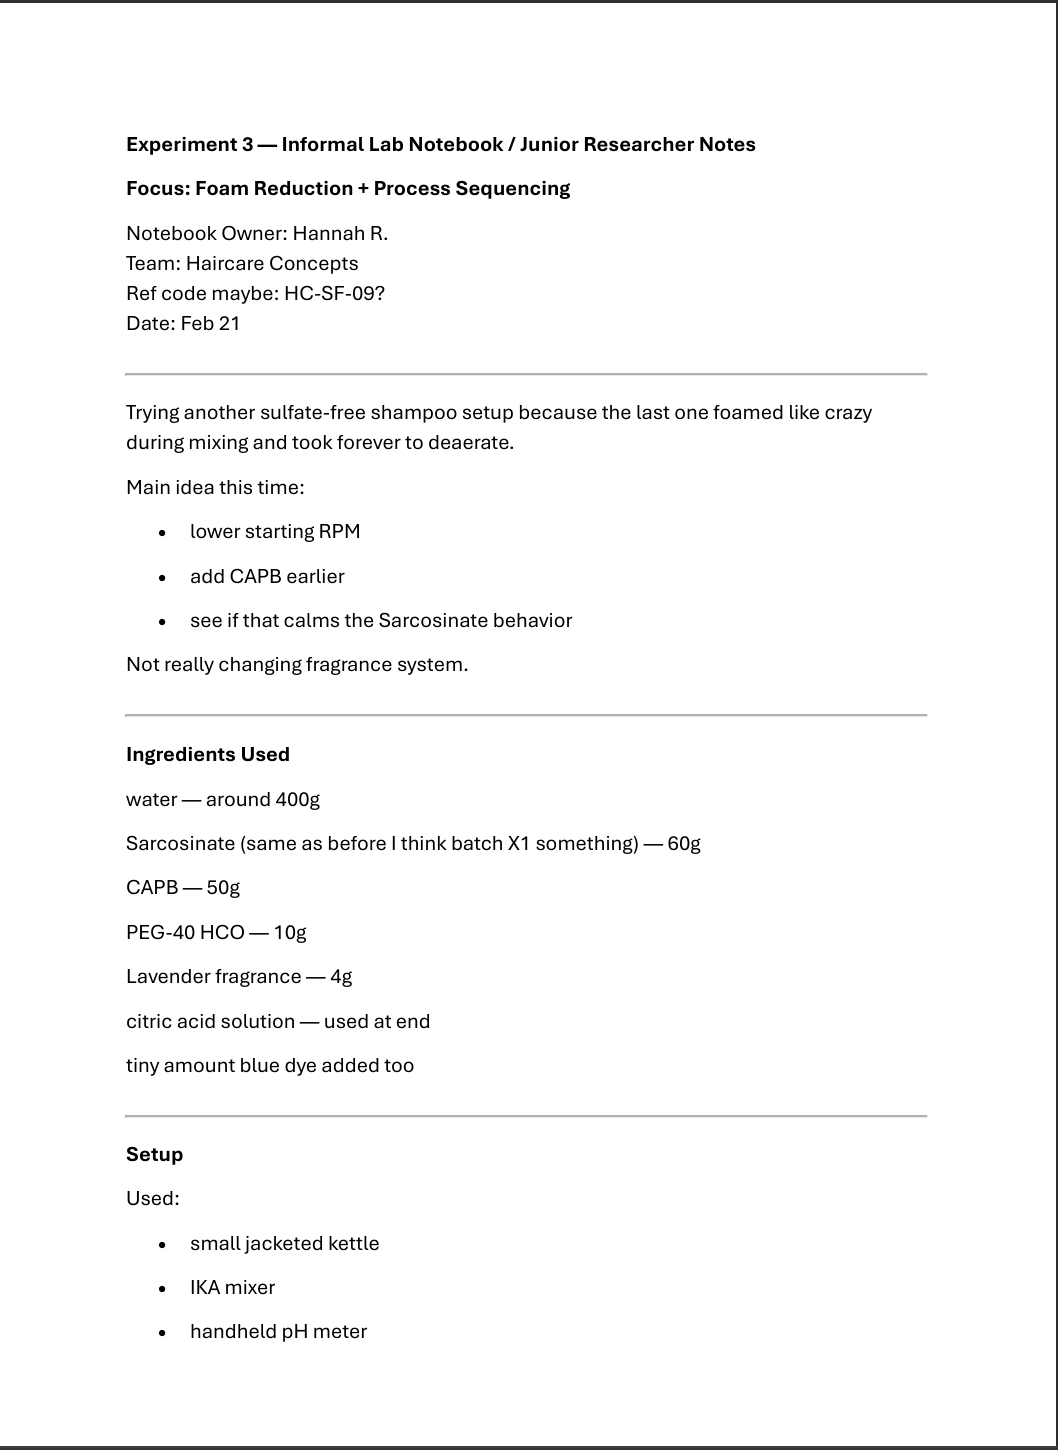
Materials with exact quantities and units, equipment with model numbers and asset IDs, step-by-step process actions with mixing speed and temperature, and measurements tagged by the stage they were taken at (intermediate vs. finished product). None of this requires a fixed template. Hannah's "CAPB, 50g" and the pilot report's "5.30 kg" both resolve into the same structured material record.
3. Variable relationships
This is the layer that goes beyond data extraction into something closer to predictive modeling. Each document is scanned for independent variables (what was changed) and dependent variables (what it affected), linked with a direction of effect and tagged by how strongly the evidence supports the claim.
This depth is worth a caveat. Extraction only works with what a scientist actually wrote down. If an observation, a batch code, or a measurement was never recorded, no amount of structuring recovers it. What this pipeline changes is what happens to documentation that already exists, however old and however inconsistent, whether that's a decade-old archive or next month's batch of notes from a site that never quite adopted the same template as everyone else.
The third layer, the relationships between variables, is worth seeing directly.
The Relationship Layer, Pooled Across All Five Documents
Summary below — download the full Excel workbook for the complete extracted relationships.
| Independent variable | Range | Dependent variable | Effect | Evidence type | Source |
|---|---|---|---|---|---|
| Mixing speed | ~100 rpm (start) | Foam volume | decrease | interpreted | HC-SF-09 |
| CAPB addition timing (added before Sarcosinate) | 50 g | Foam volume | decrease | interpreted | HC-SF-09 |
| Temperature | 40–50°C | Appearance (clarity) | improves | interpreted | HC-SF-09 |
| NaCl concentration | 0.3% to 0.6% | Viscosity | increase | derived from data table | PP-17-026 |
| NaCl concentration | 0.6% to 0.9% | Viscosity | decrease | derived from data table | PP-17-026 |
| PEG-40 HCO concentration | 1.5% to 3.0% | Appearance (clarity) | improves | explicit (stated) | CS-221-A07 (DoE) |
| PEG-40 HCO concentration | 1.5% to 3.0% | Foam volume | increases | explicit (stated) | CS-221-A07 (DoE) |
| Mixing/shear strategy | 1,500–3,200 rpm, split shear | Foam volume | decrease | explicit (stated) | CS-221-A07 (DoE, Prototype C) |
| CAPB concentration | 7.0% to 9.0% | Foam quality | improves | interpreted | CS-221-A08 |
| Sarcosinate concentration | 14.0% to 15.5% | Viscosity | increase | interpreted | CS-221-A08 |
What matters about this table is not any single row, but that every row came out of a document organized on its own terms, by its own author, and all ten now sit in the same schema.
Three things about it are worth calling out.
First, it's traceable. Every relationship carries the exact text it was drawn from and, where available, a page reference, so a scientist can always click back to the original evidence rather than trust an opaque summary.
Second, it distinguishes confidence levels. A relationship derived directly from a data table, like the NaCl-to-viscosity curve, is tagged differently from one interpreted from a scientist's narrative reasoning, like Hannah's mixing-speed observation, or one the original author stated as an explicit conclusion. A reader, or a downstream model, can weight these differently rather than treating every claim as equally certain.
Third, once the table exists, it can be read across documents rather than within one. That's where the value actually shows up.
Just One Example of What Becomes Visible
Reading across this table surfaces a pattern that no single document states on its own. The CS-221-A07 DoE study, filed Feb 14, recommends as a next step to "investigate foam suppression via surfactant order modulation rather than solubilizer increase." A week later, in an entirely separate, informal notebook, Hannah changes the surfactant addition order and lowers mixing speed, and records a real result: less foam.
Neither document references the other, and neither was written with the other in mind. One is a structured, multi-prototype ELN comparison; the other is a first-person note with a batch code marked "same as before I think." Once both are mapped onto the same relationship schema, the connection is direct: the same independent variable, the same dependent variable, the same direction of effect, corroborated a week apart by two people who had no reason to know about each other's work.
From Relationships to Recommendations
This is what "mapping the relationship between independent and dependent variables" is actually for. Once relationships like these are pooled across many experiments, each one tagged with direction, evidence strength, and traceable source, regardless of how each individual experiment happened to be written up, they form the seed of a predictive model of the formulation's response surface. Lower mixing speed and CAPB-first addition reduce foam. NaCl has a real optimum near 0.6%, not a linear effect. PEG-40 HCO improves clarity but trades off against foam. Higher CAPB relative to Sarcosinate improves foam quality, but Sarcosinate drives viscosity.
None of these are new discoveries. They already existed, spread across five documents, each organized on its own terms. What changes is that a scientist starting a new experiment doesn't have to manually reconstruct this map by rereading everything in the archive. With five experiments, this would still be possible to do manually but organizations have several thousand of experiments in their historical corpus. Augmend can surface it directly, with the evidence attached, as a starting hypothesis rather than an ending one. That's the mechanism behind recommender systems for new formulations and in-silico experimentation: testing a proposed change against the pooled historical relationships before running it on the bench. This is a major driver of an organization's innovation speed and productivity.
If you'd like to see what's hiding in your own archive of experimental records, pilot batch reports, and informal notebook entries, we'd like to talk.
Schedule a CallFrequently Asked Questions
Does lab data need to be recorded consistently before it can be structured?
No. A structured ELN entry, a pilot plant batch report, and an informal notebook page, written years apart by different people, can all be mapped onto the same schema regardless of how differently each one was originally organized. That covers both an old archive and ongoing variation between teams or sites today.
Can AI extract more than raw data from lab notebooks, such as relationships between variables?
Yes. Beyond materials, equipment, and measurements, extraction can identify which variables were deliberately changed (independent variables) and which outcomes they affected (dependent variables), along with the direction of the effect and how strongly the source text supports that claim.
What's the difference between "explicit," "interpreted," and "derived" relationships in extracted lab data?
An explicit relationship is one the original author directly stated as a conclusion. A derived relationship is computed straight from a data table, such as a measured value at different concentrations. An interpreted relationship is inferred from narrative reasoning in the text. Keeping these distinct lets a reader, or a model, weight each claim by how solid the underlying evidence is.
Can this kind of extraction support predictive modeling of lab data?
Yes. Once independent-to-dependent variable relationships are extracted and pooled across many experiments, with consistent variable names and confidence levels, they form a structured basis for building recommender systems or running in-silico experiments: evaluating a proposed formulation change against historical evidence before running it on the bench.
Does structuring reduce how much scientists need to document?
No. Extraction can only work with what was actually written down; a missing observation or batch ID can't be recovered afterward. What it removes is the burden of making that documentation comparable and searchable, which otherwise falls on the scientist at the moment of writing it up.
Do scientists need to change how they record experiments to benefit from this?
No. Structuring happens after the record is written, so historical ELNs, batch reports, or informal notes can be extracted as they are, with no rewriting required. It works the same way on new records too, which matters given how often different teams, sites, or countries end up with their own habits regardless of what template they were handed.